
Event Details
The Event Details page provides a complete view of a specific event and the betting data received from its providers.
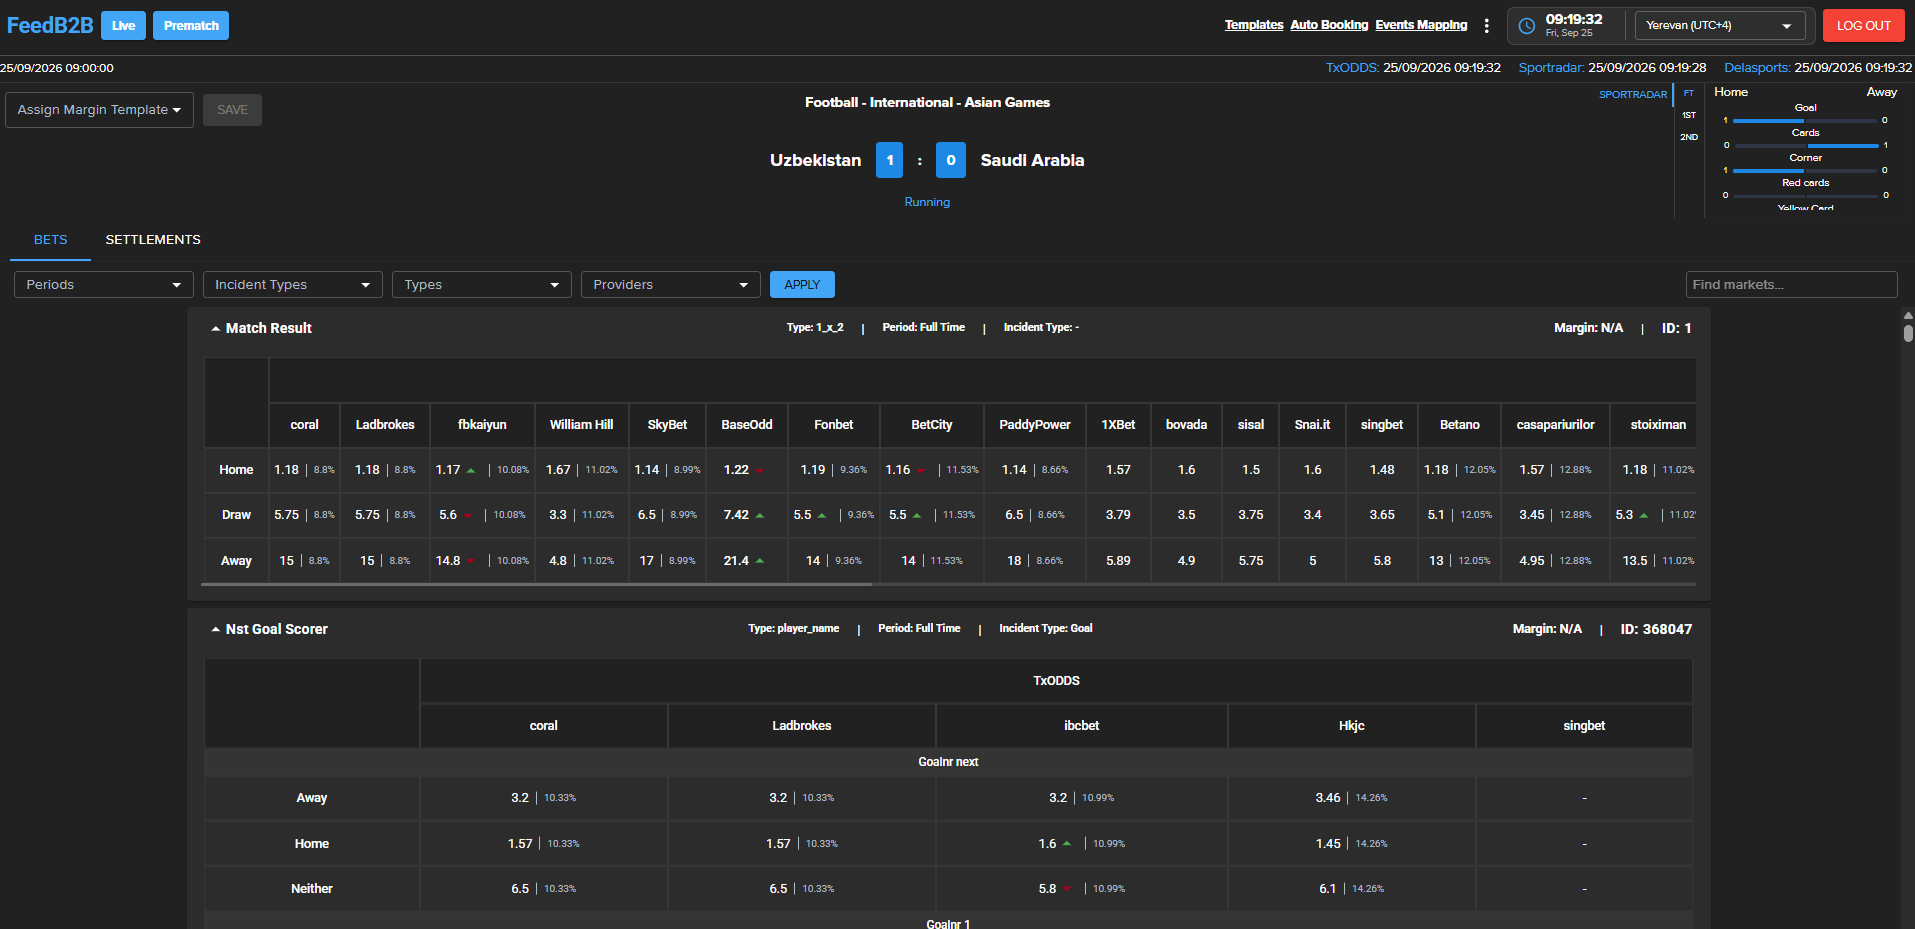
When the same event is available from multiple providers, their data is displayed together for easy comparison.
Event Information
The top of the page shows the main event information:
- Sport, location, and league
- Participants and current score
- Event status and start time
- Providers supplying the event
- Match statistics, when available
Bets & Settlements
Use the two main tabs to switch between:
Bets — markets, bets, and odds received from providers.
Settlements — settlement information received for the event.
Markets
Markets are displayed as separate sections, such as Match Result, Double Chance, or Next Goal Scorer.
Each market may include:
- Market name and ID
- Type
- Period
- Incident type
- Margin
- Bets and odds
Markets can be expanded or collapsed.
Type and Base Market Type
Every market is classified in two independent ways.
Type describes what the bets look like: which bet names the market can have and whether the bets carry a line. For example:
1_x_2— Home, Draw, Awayover_under— Over, Under, with a line such as 2.5yes_no— Yes, No
Base Market Type describes what question the market asks, for example Winner, Total, Handicap, or First to Score.
The two are separate because one type can serve many questions, and one question can come with different types:
| Market | Base Market Type | Type |
|---|---|---|
| Match Result | Winner | 1_x_2 |
| Double Chance | Winner | double_chance |
| First Team to Score (3-way) | First to Score | 1_x_2 |
| Total Goals Over/Under | Total | over_under |
| Total Goals Odd/Even | Total | odd_even |
A base market type never includes the period, incident type, or team, because those are shown separately. For example:
1st Half Home Team Total Corners Over/Under = Base Market Type Total + Type over_under + Period 1st Half + Incident Type Corners + Home team.
Base market types:
| Group | Base Market Types |
|---|---|
| Result | Winner, Handicap, Winning Margin, Correct Score, Double Result, Race To, Lead After, Win Periods, Win to Nil, Method of Victory, Head to Head |
| Totals | Total, Highest Scoring Period |
| Scoring & events | To Score, Both Teams to Score, Clean Sheet, First to Score, Next to Score, Last to Score, Time of Score, Scoring Method, Event Occurs |
| Player & outright | Top Performer, Outright Winner, Top N Finish |
| Combinations | Winner & Total, Winner & Both Teams to Score, Both Teams to Score & Total, Winner or Total, Winner or Both Teams to Score, First to Score & Winner |
Providers & Odds
When a market is available from multiple providers, their data is displayed side by side.
Providers may also contain multiple subproviders, which are usually betting companies. In this case, odds from each subprovider are shown separately.
This makes it easy to compare available odds for the same bet across different data sources.
Margins
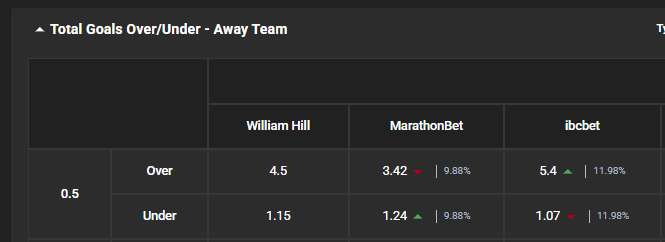
FeedB2B automatically calculates and displays margins for available odds, helping traders quickly understand the pricing offered by different providers and subproviders.
The calculated margin is shown next to the corresponding odds:
3.43 | 5.49%
where 3.43 is the odd and 5.49% is the calculated margin.
For markets with different lines or combinations, such as European Handicap or Totals, margins are calculated separately for each relevant set of bets.
Displaying margins directly alongside the odds allows traders to:
- Quickly compare pricing across providers and subproviders.
- Identify significant differences in margins.
- Better understand where attention or adjustment may be required.
BaseOdd & Margin Templates
BaseOdd represents the odd without a margin applied. It is displayed only for providers that supply this value.
This allows users to compare the original margin-free odd with the provider’s offered odds.
A Margin Template can be assigned to an event from the top of the page. The selected template determines how margins are applied to the event's odds.
Provider Rules
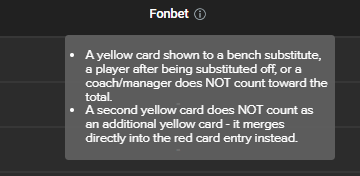
For some providers and subproviders, additional information about provider-specific rules is available directly on the Event Details page.
When available, hover over the information icon next to the provider or subprovider name to view these rules.
For example, the information may explain how yellow cards, red cards, or other incidents are calculated by that provider.
These details help users understand differences in how individual providers interpret and calculate event data.
Filters & Search
Use Period, Incident Type, Type, and Provider filters to narrow the displayed markets.
The Find markets field can be used to quickly find a specific market by name.